Monitoring the training process in team sport
After the outbreak of the COVID-19 pandemic, (inter)national football associations will strive to complete the 2019-2020 season in the next few months. Because the 2020-2021 season is already on its way, a high number of matches over a short period of time can be expected. Such congested match periods do not only impose an increased physical load on players, but may also exhaust players mentally by match stress and travel requirements. Therefore, it is important that practitioners understand the relationship between load and fatigue to assess players’ readiness for the next match. Similarly, during non-congested periods, fatigue analysis may provide useful information to assess players’ readiness for a training session.
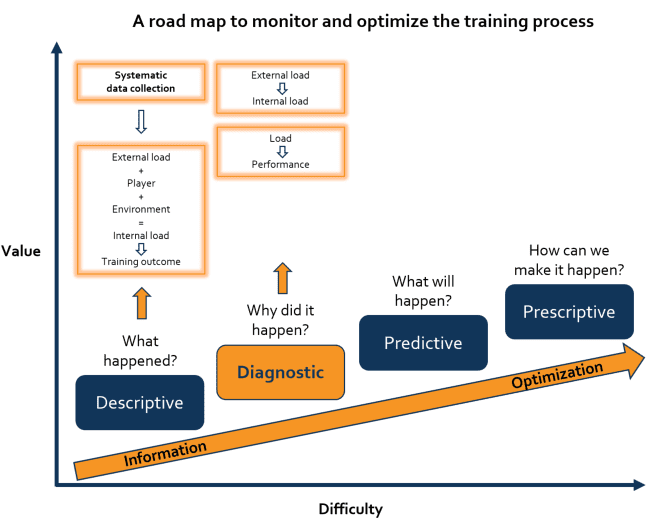
As a continuation of our previous blog, examining the relation between load and fitness (link to blog), we will discuss some evidence- and practice-based advice concerning the load-fatigue analysis. This type of analysis finds itself in the diagnostic stage of our road map (figure 1).

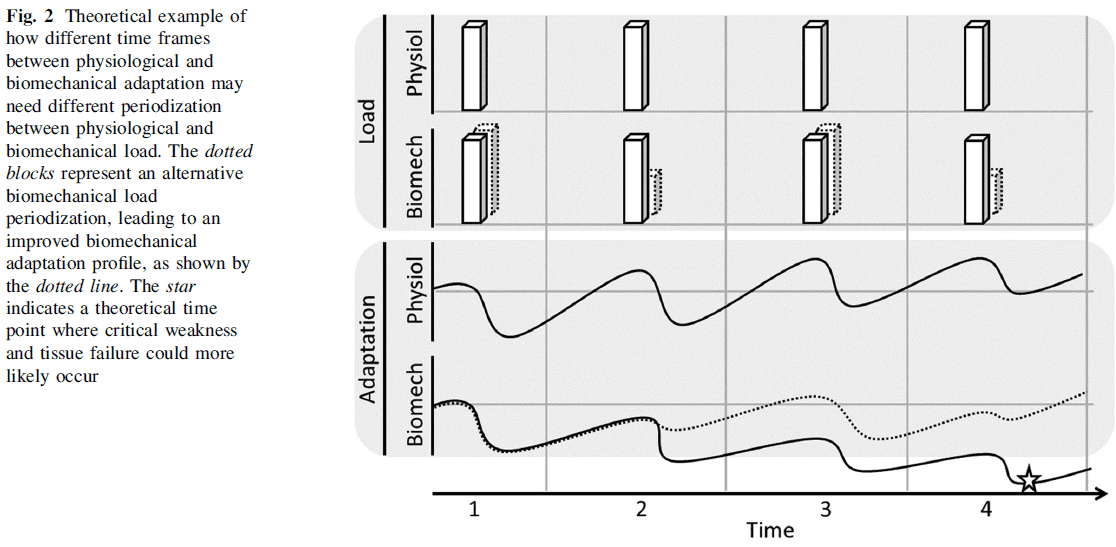
Before we dive into some methods for monitoring fatigue, it may be useful to describe the physiological time course of recovery after team sport activity. In 2019, the multifactorial nature of fatigue and corresponding recovery processes was highlighted by Skorski and colleagues (link to article). The authors demonstrated that the various physiological systems are affected differently by fatigue. The magnitude of fatigue and subsequent recovery time course of the cardiovascular and neuromuscular system was shown to be dependent on the type and amount of load of the previous training session(s) and/or match(es). For example, very high-intensity sessions can lead to recovery time courses of more than 72 hours. Logically, the relation between the training load and fatigue differs between the different physiological systems, which is well described in an article by Vanrenterghem and colleagues (link to article).
Figure 2 of this article clearly illustrates the importance of distinguishing between systems as a possible undetected dissociation between systems could cause insufficient recovery and adaptation in a particular system, possibly leading to system failure such as injury or overtraining.

In practice, however, direct measurements of physiological indicators are difficult and often invasive. Therefore, fatigue is often measured in terms of performance decrements in strength, agility or speed. In this respect, time-courses to full performance recovery are reported from 12 to more than 72 hours. The relationship between the physiological recovery markers and the performance recovery markers is however still unclear with no single physiological marker having a direct relationship with performance recovery. In addition, Skorski and colleagues demonstrated that in some situations performance is maintained irrespective of the presence of physiological fatigue, thereby providing evidence for different time-courses in physiological and performance recovery markers. Based on these findings, the authors recommended adopting a multifactorial approach to monitor fatigue and recovery. Possible approaches are discussed in the following paragraphs.
Subjective well-being indicators
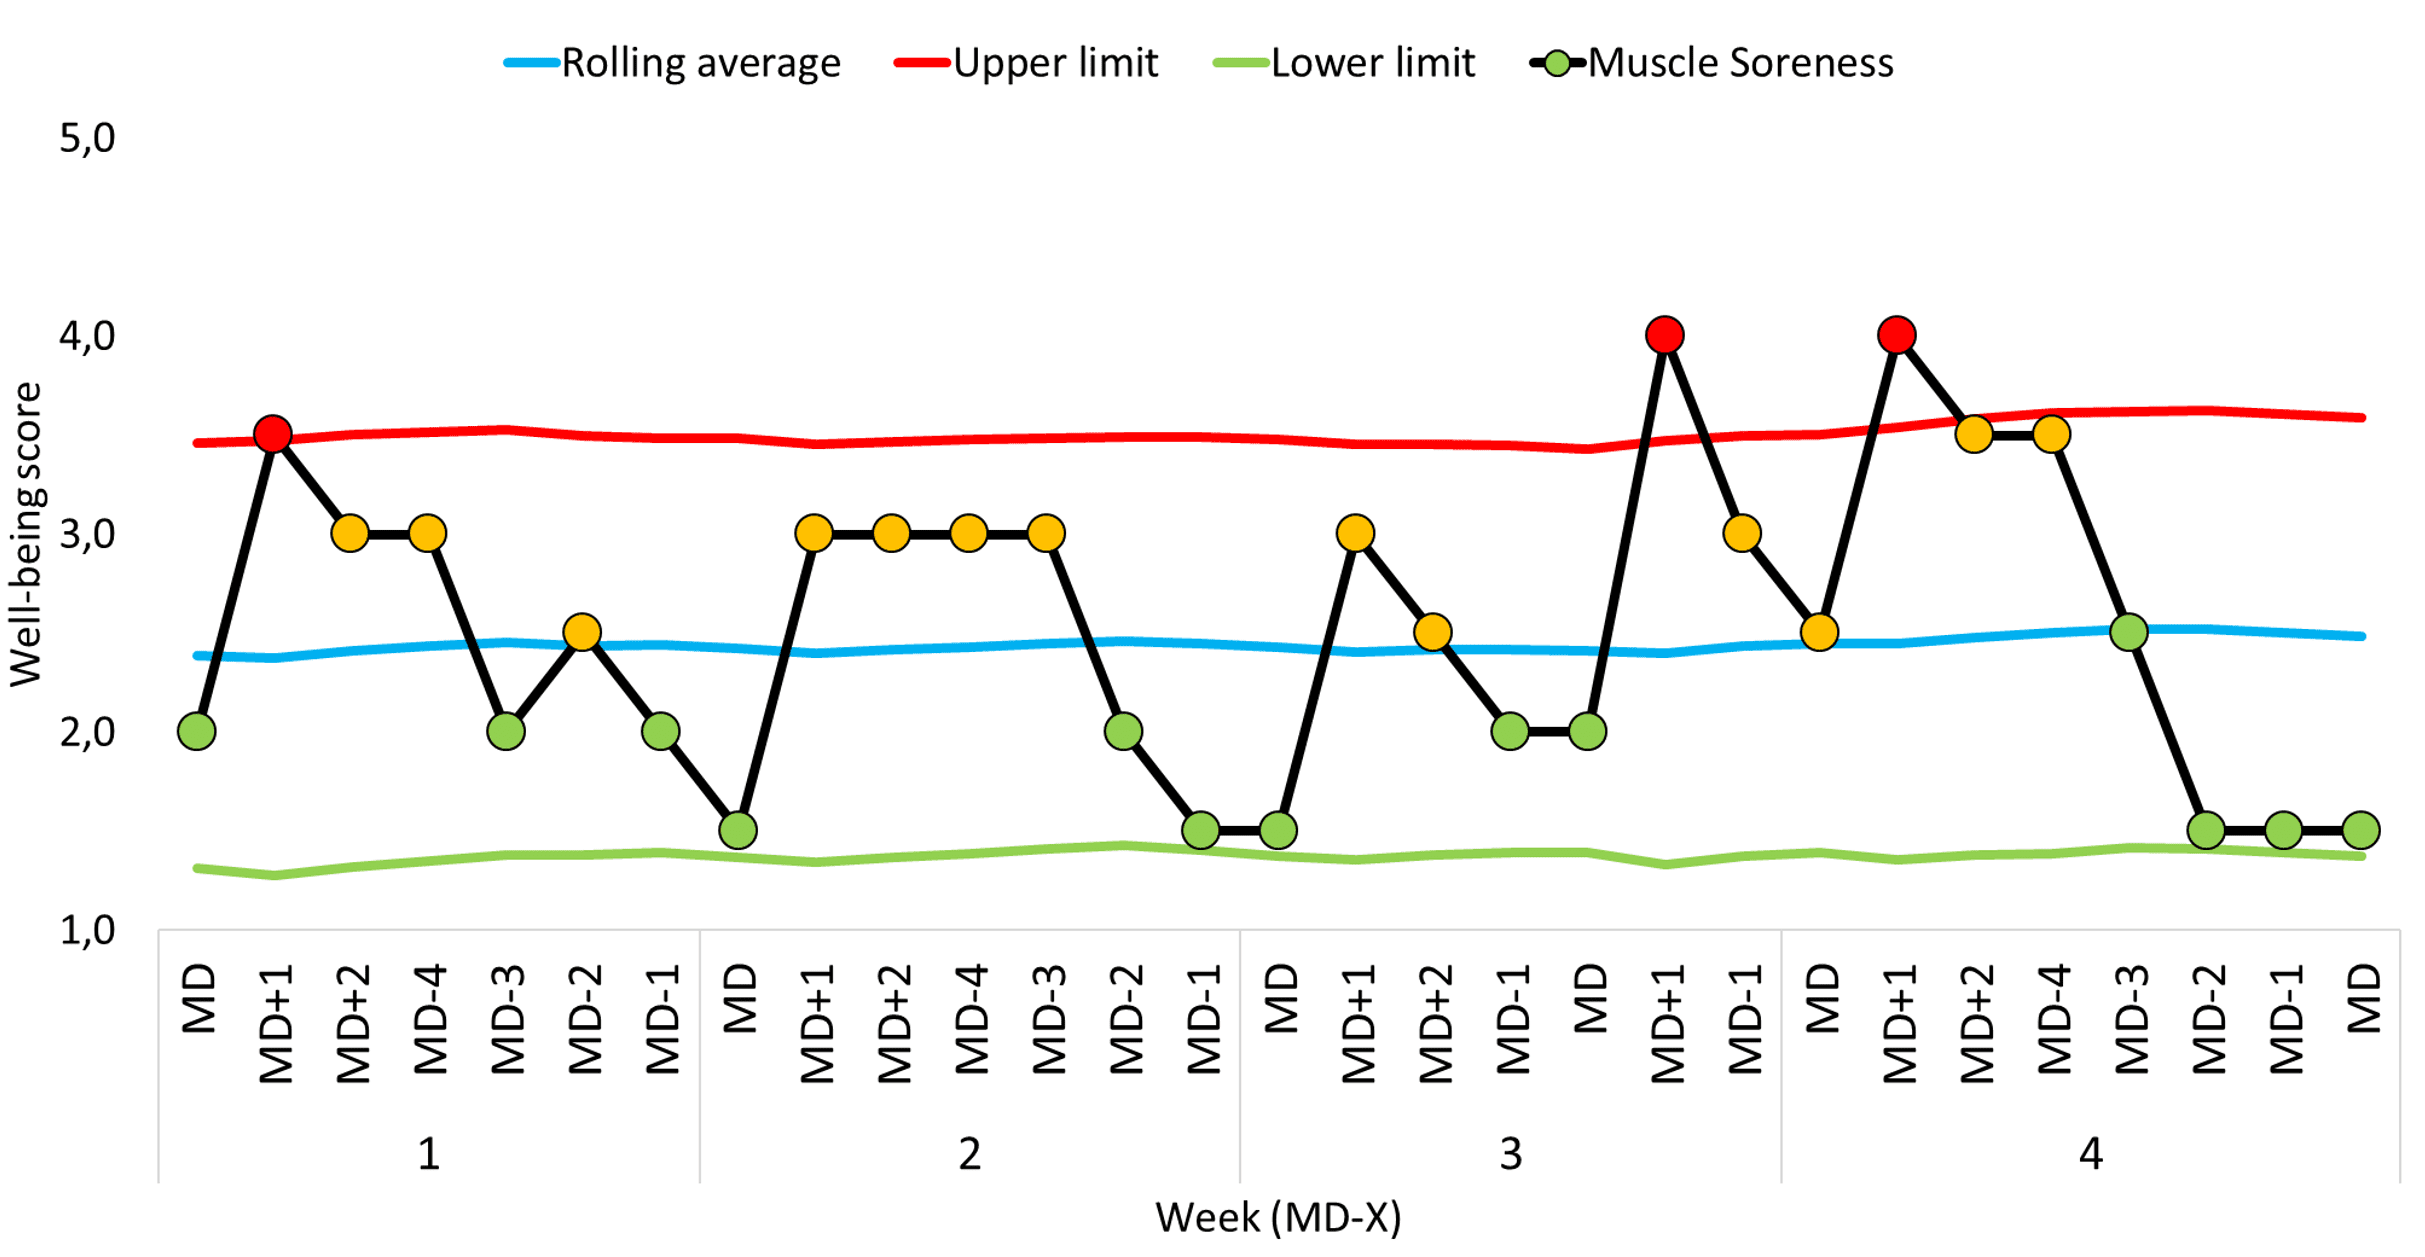
In a series of articles, Thorpe and colleagues evaluated different fatigue indicators to assess their usefulness in a professional football environment (link to articles). It was demonstrated that subjective well-being indicators such as sleep, muscle soreness, and fatigue, were most sensitive to changes in accumulated 1 to 4 daily training loads. These findings, together with its ease of use and low cost, support the practical relevance of using well-being measures on a daily or weekly basis. They do not only provide an indication of the fatigue state of a player but could also serve as a communication tool between players and staff. To guarantee its usefulness, it is, however, important to educate players and staff appropriately about the benefits, so that reporting is honest and well-thought-out. To analyze these data, one can calculate a global well-being score by summating the different well-being items (sleep, muscle soreness, fatigue, mood, stress…). However, to gain a better understanding, we advise analyzing trends for each individual well-being item. For this, easy statistics such as Z-scores or statistical process control (SPC) could be used to detect relevant trends or deviations (link to article). A hypothetical illustration of SPC can be found in figure 3. A player’s perceived muscle soreness is presented over a 4-week period, with higher scores reflecting higher perceived soreness. In addition, two control limits are calculated via the following formulas:
- Upper limit: average perceived muscle soreness (e.g. last 60 days) + 1,5 * standard deviation
- Lower limit: average perceived muscle soreness (e.g. last 60 days) – 1,5 * standard deviation
These control limits can be considered as boundaries to distinguish relevant deviations from normal responses. For example, after playing a mid-week match in week 3, higher levels of perceived muscle soreness were observed, possibly indicating the player’s need for extra recovery. Such easy analyses can be very helpful in guiding the pre-training decision-making. However, given the multifactorial nature, it is always advised to combine this with other objective fatigue indicators.

Objective cardiovascular fatigue (CVF) indicators
The influence of fatigue on the cardiovascular system can be determined via heart rate (HR) monitoring. In 2018, Christoph Schneider and colleagues summarised the evidence about the use of HR to determine training outcomes in team sport (link to article). The authors distinguished between resting- and exercise HR indicators. Both are modulated by the autonomic nervous system but differ in their relation to fatigue.
Measuring resting HR has several benefits such as a high degree of standardization and the possibility to monitor on non-training days. However, players have to be educated appropriately to perform these measures individually, which is not self-evident in a professional football context. Therefore, pre-training recordings could be considered as a valuable alternative. Previous research observed an increased HR rest as an indicator of short-term fatigue. Recently, HR variability was proposed as a more sensitive indicator (the lower, the more fatigued). However, this superiority can still not be confirmed. To increase the validity of these resting measures, it is recommended to use rolling averages and express day-to-day changes as a weekly coefficient of variation. In contrast to resting HR, exercise HR may be more helpful in understanding long-term fitness changes instead of acute fatigue changes (see or previous blog, link to blog). Therefore, when determining fatigue, it is recommended to use resting HR indicators. As explained properly by Schneider et al (link to article), it stays important to analyze these indicators in relation to the training context. Furthermore, given the intermittent and high-intensity nature of a team sport such as football, neuromuscular fatigue indicators may be of higher interest in light of injury risk reduction.
Objective neuromuscular fatigue (NMF) indicators
NMF can be defined as “an exercise-induced reduction in maximal voluntary contraction (MVC) force or the inability to produce a certain expected force or power”. Although this definition is widely used, a recent article of Place and Millet (link to article) highlighted some issues towards this definition, such as the influence of the motivation of the player to perform the test and the presence of low-frequency fatigue (<-> MVC). As this is beyond the scope of this blog, we would like to refer to the article itself for more explanations.
In football, the produced force by the lower limbs is of main interest because the capacity or power to transmit forces by the lower limbs is related to the ability to perform high-intensity accelerations or sprints. Therefore, jump testing is often applied to assess the influence of the preceding load on the explosive power of the lower limbs, with acute reductions in power possibly indicating fatigue. Here, jump height is mainly used as an indicator of jump performance. Several studies demonstrated reductions in jump height in response to a preceding training load. Recovery times were shown to be dependent on the amount of load, varying between 24 and 72 hours. However, when only the jump height is considered, some fatigue manifestations may be overlooked. A study from Gathercole and colleagues (link to article) raised attention towards the dissociation between jump performance and jump movement execution. Specifically, they showed that fatigued players could maintain or restore their jump performance before being fully recovered. It appeared that these players changed their movement strategy, which can be considered a risk factor for developing physical complaints or injuries. To detect this altered movement strategy, the ratio of flight time to contraction time (FT:CT) was proposed as a useful indicator of fatigue. The flight time is the time spent in the air from jump take-off to landing. The contraction time is the duration from jump initiation to take-off. Fatigue may be reflected by lower FT:CT values, characterized by longer contraction times relative to certain flight times. Although the underlying mechanisms are still somewhat unclear, decreased reflex sensitivity may cause movement changes being mainly present in the eccentric phase, reflected by higher eccentric durations and enhanced eccentric-velocity productions, possibly aimed to limit the concentric-performance decrements. Therefore, we conclude that jump testing may be an appropriate method to quantify NMF but that other indicators beyond jump height need to be explored to provide more information than solely performance. In this respect, FT:CT is a promising indicator to detect the presence of an alternative movement strategy.
Because football is a running-based sport, quantifying similar changes in movement strategy while running may provide more football-specific information. Several researchers, therefore, started to explore the use of submaximal running protocols to quantify NMF based on movement analysis. For this, protocols such as box-to-box runs (4 reps) at an average speed of 12 km/hr or steady-state running at 12 km/hr on a rectangle or oval course are used. The majority of studies focused on the use of accelerometer-based indicators such as player load, which is developed by the company ‘Catapult Sports’ (link to website). Player load reflects the cumulative rate of change in acceleration in the three different postural planes: anterior-posterior, vertical and mediolateral. While these can be combined in a global 3D player load indicator, research examining NMF is mainly related to the 1D player load indicators, in particular, the vertical and mediolateral player load. Although the available evidence is currently still limited, an increased mediolateral player load may, for example, indicate a higher mediolateral sway of the body (less postural control) that can be caused by fatigue. In addition, NMF can cause a lower percentage contribution of the vertical player load to the total player load, explained by the mechanism of vertical stiffness. This can be defined as the ratio between peak ground reaction forces and the peak vertical displacement of the center of mass of the body. In presence of NMF, peak ground reaction force is reduced leading to an increased vertical displacement. Because ground contact times are increased, lower body accelerations in the vertical plane can be observed, reflected by a lower vertical player load. Although these studies show promising results, more research is needed to validate the ability of player load indicators to reflect NMF based on the mentioned underlying mechanisms. If validated, these measures could provide more football-specific information in addition to jump testing.
To conclude, this blog aimed to discuss the relationship between load and fatigue. We highlighted the multifactorial nature of fatigue and we proposed some evidence- and practice-based approaches to quantify fatigue in a professional football setting. The management of fatigue is important to guarantee player readiness. In addition, high fatigue may increase injury risk, which we will discuss in our following blog. Stay tuned and keep safe!