Monitoring the training process in team sport
In our previous two blog posts, we described the relation between load and performance. In addition, several tools were discussed to monitor this relationship in practice (link to blog, link to blog 2). It is important to emphasize that the first step to performance is the availability of your players for training and match sessions. Various research studies showed that player availability is an important factor for success in professional team sports. Player unavailability is often caused by injury, which highlights the importance of injury prevention strategies. In Australian Football, Hoffman and colleagues (link to article) found that team’s injury burden (i.e. the combination of the number of injuries and the injury severity) explained up to 12% of the variation in the final league ranking. Interestingly, this study showed that the effect was strongest when the player value was taken into account. This highlights the importance of keeping your best players injury-free. In professional football, Hägglund and colleagues (link to article) examined the relation between player availability and performance using data from the UEFA injury study. An increased seasonal player availability and a lower seasonal injury burden were associated with an increased number of points per domestic league match. Furthermore, higher availability and lower injury burden resulted in higher performances in European cup competitions. Based on these findings (together with the social responsibility of keeping players healthy), practitioners award considerable attention towards injury risk prevention strategies.
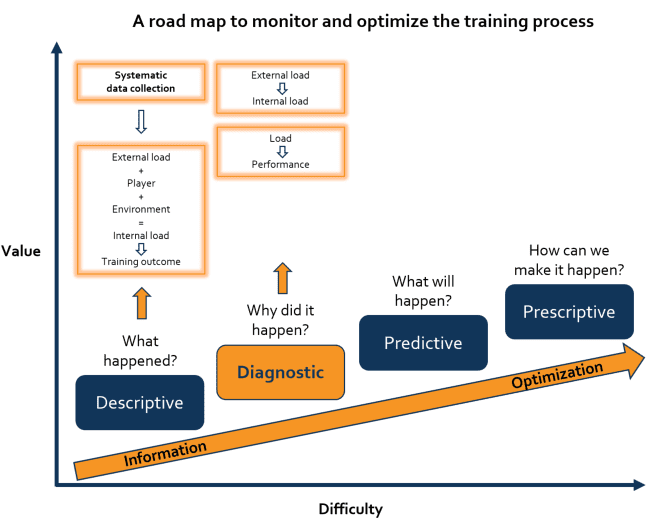
One of the applied strategies to mitigate injury risk is the day-to-day management of training and match load. In the current blog, we will discuss the relation between load and non-contact injury risk. In addition, we will provide some advice about load management to reduce non-contact injury risk. The load-injury relation is situated in the diagnostic stage of our road map.

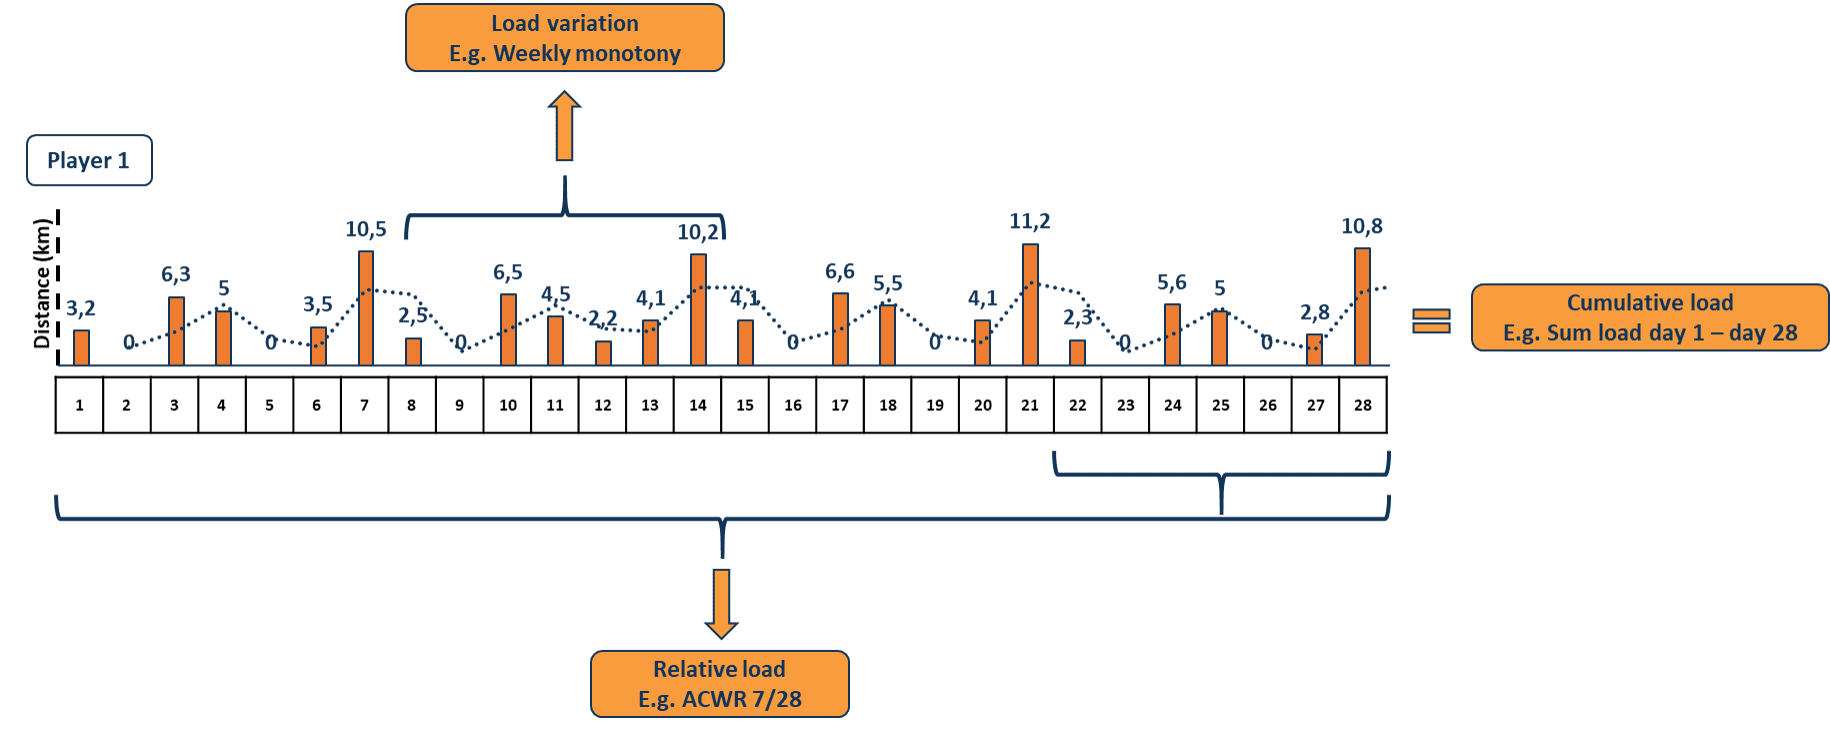
The acute or repetitive application of load results in tissue damage. When the capacity of the tissue to withstand this damage is exceeded, tissue failure can occur resulting in an injury. As properly explained by Kalkhoven, Watsford, and Impellizzeri (2019) (link to article), the applied load to the tissue can be divided into stress and strain. Stress refers to the internal forces experienced by the tissue. Strain is defined as the amount of deformation or length change in the tissue in the direction of an applied force. These two definitions highlight the importance of the relation between the mechanical load and injury risk. However, in current practice it is still impossible to quantify the mechanical load in a direct way (link to article). External load indicators such as the distance ran or the number of sprints completed are often used as a derivative to estimate the load on the musculoskeletal system. However, it is important to consider that the same external load may result in a very different internal mechanical load. For example, the same running velocity for 2 players can impact the players in a very different way on the level of the musculoskeletal system (i.e. internal load) because of individual differences in running technique, posture, stability etc. When analysing the combined load of certain training sessions and/or matches, one can distinguish between cumulative load, relative load and load variation.

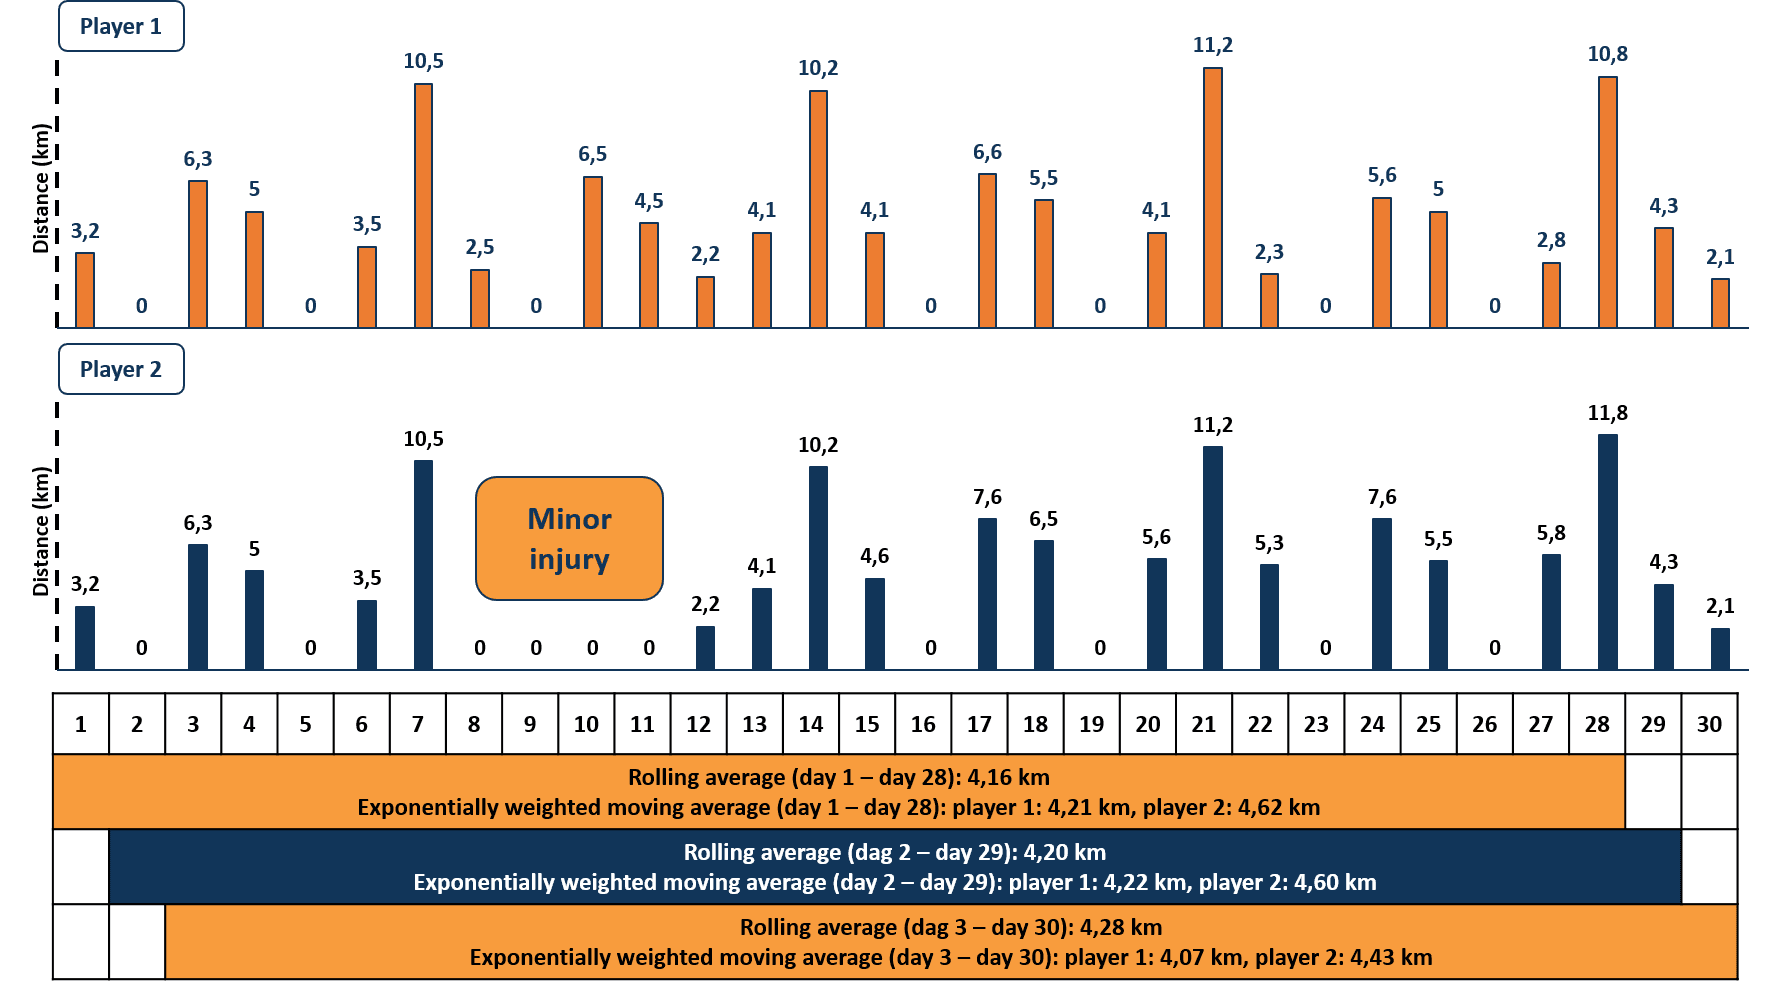
Cumulative load is the averaged or summated load over a given time window and is in general expressed as the daily, weekly or monthly load. The cumulative load can also be calculated for each micro-, meso- and macrocycle. To calculate the cumulative load on a daily basis, rolling averages (or sums) are used. Figure 3 illustrates the cumulative load of two players in a 28-day time window. Although rolling averages provide useful information about the past training load, Paolo Menaspà highlighted two important limitations of this method (link to article). First, averages do not consider the variation in load during a given period. For example, in our illustration, player 2 suffered a minor injury and did not train from day 8 to 11. While the load variation was different between player 1 and 2 during this period, the resulting rolling average load was identical. So two players can have the same rolling average load, but the way to obtain this load can be different. Second, simple rolling averages do not take into account the decline of the effect of a training load over time. In training theory, the effect in terms of fitness and fatigue for previous training loads is different than the effect of more recent training loads. Therefore, it may be appropriate to consider the effect of the timing of training loads in which more recent training loads receive a higher weighting impact. The use of exponentially weighted moving averages (EWMA) was proposed to be superior than rolling averages and can be calculated as follows:
EWMAtoday = Loadtoday X ƛa + ((1 – ƛa) X EWMAyesterday)
met ƛ a = 2 / (N+1)
met N = chosen time decay constant
In our illustration, the EWMA of player 2 is higher than player 1, indicating that the recent load was higher for player 2 compared to player 1. It is, however, important to notice that this formula does not reflect biophysiological recovery mechanisms as is sometimes thought.

The relationship between cumulative load and injury risk is still unclear. Intuitively, one can reason that injury risk will increase with higher cumulative loads as result of exceeding the load capacity of an athlete. The use of load thresholds, specific to the sport (level), may be considered useful (link to article). However, thresholds may be individually different and context specific. For example, a previous injury can make a particular player more prone for injury compared to his teammates. In addition, thresholds may differ between season periods and corresponding environmental conditions. Finally, if periodized appropriately, high cumulative loads will increase player fitness, resulting in a higher load tolerance. This could help reducing the risk of injury. Therefore, it is advised to consider variable thresholds by estimating players’ load tolerance. The application of relative load models may be useful as these models focus more directly on the balance between load and load tolerance. It is important to note that relative load models often use ratios to normalize data, which is not always statistically justified (link to article).
The most discussed relative load model of the last years is the acute-chronic workload ratio (ACWR). This model was originally proposed as the ratio between the average load of the last 7 days (acute load, fatigue component) and the average load of the last 28 days (chronic load, fitness component) (link to article). The relation between ACWR and injury risk was described as an U-shaped curve with a ‘sweet spot’ between values of 0.8 and 1.3. An ACWR value > 1.0 indicates that the acute load is higher than the chronic load, which is interpreted as “the player is doing more than he is normally used to”. The higher the ACWR value above 1.0, the higher the difference between acute and chronic load. An ACWR value < 1.0 indicates that “the player is doing less than he is normally doing”. In various papers, the ACWR was linked to higher and lower injury risks for different load indicators. Given its simplicity and plausibility, the ACWR became a very popular model among both practitioners and researchers. However, criticisms gradually grew, raising questions about 1) the way ACWR was ‘popularised’, 2) the physiological rationale and 3) the research methods used. It is beyond the scope of this blog post to go into detail about this debate. For more information, we would like to refer to the following articles:
Gabbett. The training-injury prevention paradox: should athletes be training smarter and harder?
Buchheit. Applying the acute:chronic workload ratio in elite football: worth the effort?
Wang et al. Analyzing activity and injury: lessons learned from the Acute:Chronic Workload Ratio
Impellizzeri et al. Acute:Chronic Workload Ratio: Conceptual Issues and Fundamental Pitfalls
Taken together, the ACWR provides a simple measure to monitor the proportion between acute and chronic load. However, from a scientific point of view, we advice to be careful in interpreting these data. As is the case with all injury risk models, a multifactorial conservative approach is preferred, thereby combining various methods to measure the load and responses of athletes. Until research and models are able to demonstrate clear causative pathways, we have to ‘trust’ our human intelligence when interpreting and using data to inform our decision-making.
The aim of applying relative load models is to control the gradual progression in training and match load. Although this sometimes could advice against the load variation, insufficient variation (monotony) may also be related to an increased injury risk. The concept of load monotony in injury risk research was introduced in 1998 by Carl Foster (link to article). He was inspired by a study on race horses. In this study, a hard day – easy day training cycle was used. It was shown that race horses developed more overtraining symptoms when the load was increased on the easy day compared to an increased load on the hard day. Therefore, it was assumed that not only load progression but also load variation contributes to the risk of overtraining. As follows, two indicators were proposed: 1) weekly monotony = daily average load / standard deviation, 2) weekly strain = weekly training load x weekly monotony. In the study, initial evidence was provided for the association between high monotony and strain and an increased risk for overtraining. However, at that time, both load and overtraining measures were still somewhat underdeveloped, which means that the results must be interpreted with caution. Also, this study focused on overtraining symptoms and not injury risk. Meanwhile, recent studies addressed the concept of load monotony in relation to injury risk. In a study of Brink and colleagues in 2010 (link to article), it was demonstrated that a higher weekly monotony was related to an increased risk of traumatic injury. In contrast, a study of Delecroix and colleagues in 2019 (link to article) showed that injury risk was lower when 4-weekly monotony was increased. These different results could be explained by the time window used to calculate monotony. Furthermore, others factors should be considered such as the type of population (youth vs. senior players) and the game schedule. In addition, during data collection, load models are often already applied by practitioners to manage the training load, thereby introducing a kind of bias in the analysis.
Taken together, it can be concluded that the relation between load and injury risk is still unclear. No single load model has shown a strong and consistent association with injury risk. More direct measurements of the mechanical load are needed to better understand the mechanical process of injury causation. This does not mean that injury risk reduction strategies are worthless. By implementing a multifactorial approach, we believe that injury risk could be managed to a certain extent. A thoughtful analysis of simple indicators such as match exposure, week-to-week changes, and injury history may already provide considerable benefits in keeping your players injury-free. More advanced analysis methods, such as machine learning (link to article), do not have to be considered as the holy grail, but could provide additional insights in the relation between multiple load and response indicators. Finally, to increase the impact of load monitoring and management, a clear and effective communication strategy is required. Flagging or traffic light systems may be helpful here (link to article).
In our latest blog posts, we discussed the diagnostic stage of our road map. We discussed the relation between:
-
external load and internal load, link to blog
-
load and performance, link to blog
-
load and fitness, link to blog
-
load and fatigue, link to blog
- load and injury risk, current blog
In these blog posts, we limited our discussion to the level of association. In our next blog, we will focus on the extent to which training outcomes can be predicted.
Cheers!